Wednesday, December 16, 2015

Monster Waves in the Pacific.....

Wave Action Pacifica Pier
....hammer the California Coast! On December 11th and 12th a High Surf Advisory was issued for the California coast with waves recorded as high as 42 feet in the Pacific. Record rains pummeled Oregon and Washington causing mud slides and flooding. On Friday December 11th I traveled to Surfers Beach near Half Moon Bay to record the action at a 5.9 foot high tide. Construction work has been on-going at Surfers Beach to address the major erosion issue near highway 1.  

Surfer Beach 12/11/15
Although the action at Surfers Beach was exciting I heard reports that the surf was off the charts in Pacifica California. I was disappointed I had chosen Surfers Beach for my photo shoot when I heard the news of Pacifica. Since the best action is at high tide I had missed the window for Pacifica.  As luck would have it the High Surf Advisory continued into the next day 12/12/15 and I headed for Pacifica at high tide!

As soon as I arrived near the Pacifica Pier I knew I was in for a treat as many of the side streets leading to the pier were closed due to flooding. I had in tow 4 cameras, a Canon 7D2 with a 10-22 wide angle lens, an Olympus E-3 with a 50-200 zoom lens, a Canon 7D with a 400 prime lens and a Panasonic video camera, not to mention my IPhone 5 smart phone. Some of my past King Tide photos have been taken during King Tides in Pacifica and I have been drenched before in the excitement of shooting and being blindsided by a wave. I've sort of come to expect a drenching in these endeavors, kind of like taking a bullet for the team!

A Single Frame from the Animated GIF
I started filming with the video camera and got a 6 minute clip of the wave action pummeling the pier and surrounding streets. The video gets more exciting at the 3 minute mark and beyond! I then started shooting with the still cameras and thought I was in a fairly safe spot after observing the wave action for awhile. The animated GIF above tells what happened next, I was totally blindsided by the biggest wave of all. I was so absorbed in the action I did not perceive the enormity of the wave about to crash on to me. I guess being oblivious to my surrounding enabled me to continue shooting and catch the entire wave frame by frame until it blanketed me......wahoo!
There was much excitement in the area, everybody was enjoying the display and you could hear owes and awes as another spectacular wave crashed ashore! I shot enough frames of a young girl having a grand time dancing and Moon Walking to the surf undulations to create the animated GIF.

Young Girl Moon Walking to the Surf
High Surf Excitement 

Wednesday, December 9, 2015

Snowy Plovers of Gazos Creek Beach

Snowy Plovers enjoying a temporary Gazos Creek Lake!

Gazos Creek Beach is located in San Mateo County about 60 miles south of San Francisco. To the south about 5 miles is Ano Nuevo State Reserve and two miles north is Pigeon Point Lighthouse.
I volunteer for an organization called Beach Watch (BW) which is an arm of FMSA (Farallones Marine Sanctuary Association) located at Crissy Field in the Presidio of San Francisco. BW consist of many teams of volunteers that survey beaches from Point Arena in Mendocino County to Ano Nuevo in San Mateo County twice per month. BW teams document live bird species and marine mammals as well as all dead birds, marine mammals and other creatures that perish on the beach. In addition beaches are surveyed for any signs of oil, be it from natural seep, ships and boats at sea and sunken vessels spewing oil or other hazardous materials.

For the last few years I've been documenting the Snowy Plover populations at Gazos Creek by counting the numbers and photographing all birds with leg bands that identify where the bird was born and banded.  Each month I send a short report to Point Blue (formally PRBO) in Petaluma California and to the Half Moon Bay Ranger Station. They in return send me what information they have on the banding locations of each individual.  

Official Status: Threatened, the Pacific Coast population of the western snowy plover is federally listed under the Endangered Species Act of 1973 as threatened. The western snowy plover is a Bird Species of Special Concern in California. Snowy plovers were listed as endangered under Washington Department of Game Policy No. 402 in 1981, and as threatened by the Oregon Fish and Wildlife Commission in 1975. The threatened status in Oregon was reaffirmed in 1989 under the Oregon Endangered Species Act.

Below are a few Snowys I've photographed on Gazos Creek Beach:


YY:AR Born and Banded at Salinas State Beach 2007
Spotted January 29th 2014 at Gazos

AO:BO Fledged Sunset State Beach 2015
Spotted at Gazos December 4th 2015

BY:GO & WO:GA Gazos 11/5/15
GO:BY banded Del Monte Beach 2015
WO:GA fledged Zmudowski State Beach 2014

AP:OA Monterey Bay Aquarium release 2014
Spotted 4 times at Gazos, latest 12/4/15

VO:BW Gazos 11/5/14
No additional sightings or information.

PV:YY Fledged Oceana Dunes 2015
Last Observation Gazos, 12/4/15

Wednesday, December 2, 2015

Buoys and El Niño Continued.........

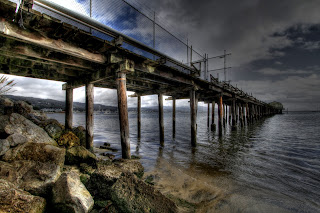
Romeo Pier Peering into the Future
This blog post is a continuation of my previous post titled El Niño and Buoy 46012 Half Moon Bay Buoy 46012
I've done some further analysis of the local buoys in an attempt to see if any relationship can be established from the buoy data with respect to the current El Niño predictions. I'm not a climatologist nor do I have a background in earth climate systems. I'm just a scientifically minded citizen very concerned about the last 4 drought years and in particular the last 2 historically warm years 2014 and 2015.

I've been tracking the SF buoy in real time along with Bodega Bay, Half Moon Bay and FTPC1 Station at Crissy Field which is a ground reporting station. This is predicted as a significant rain/El Nino event as I will track and compare it to 1997-98 and 1982-83 to see how 2015 compares?

Summary of Buoy Data
Buoys transmit data hourly throughout the year which consist of wave height and periods, water and air temperatures and barometric pressures plus additional parameters. The last two El Niño events were 1982-83 and 1997-98. I’m concentrating primarily on 1997-98 because it’s most recent and I have a good recollection of that year because of the unusual and impressive rain totals. There are gaps in the buoy data and the most significant gap I encountered was the Half Moon Bay (HMB) Buoy 46012 which likely due to technical issues as no water temperature data for the entire year of 1997. However the San Francisco Buoy (SF) 46026 has more complete water temperature data up until 11/24/1997. However the water temperature data is absent for the remainder of 1997 and is absent for 1998 until 2/28/98. So there are 3 months of contiguous missing water temperature data occurring during the peak El Niño which is a little discouraging! I may in the future explore the Bodega Bay (Bodega) Buoy to see if it has more complete data.
In the general bay area waters I rely on 3 buoys, HMB, SF and Bodega and they generally follow the same temperature progression. January thru about June water temps average about 13°C and start to warm up reaching a peak in September of 15°C, then October thru December the temperatures decrease with the coming of winter back to about 13°C.

What Did 1997 Look Like? 


The 1997-1998 rainfall season was one of nearly epic proportions for San Francisco.  Numerous San Francisco records were set as the influences of an extremely strong El Niño were felt throughout the State.
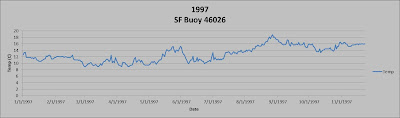
SF Buoy 1997
Most notably it was the second wettest rainfall season (47.22 inches) in the 149 seasons since records began in San Francisco in 1849.  The previous second wettest season was 45.85 inches in 1889-1890.  The seasonal record remains 49.27 inches from 1861-1862; however over 24 inches of that season's total fell in the month of January 1862.  [The average seasonal rainfall (1961-1990) is 20.52 inches.]


Possibly more remarkable were the record 119 days when measurable rainfall was recorded, shattering the previous mark of 107 from the 1889-1890 season.
Fig.4. Water Temperatures
1982/1997/2008/Present
Summary
Figure 4 is a comparison of 3 previous years, 1982 and 1997 last El Niño years and 2008 a typical year to the present year 2015. Note the 1997 data ends on November 24, 1997. All curves basically follow the same pattern peaking in the early fall and dropping as the year ends. The 1997 data deviates from that pattern showing a higher temperature of about 5 degrees F and not fading as other years do. As mentioned before the data is limited and has missing information for 1997. It's interesting to note that in November of 1997 San Francisco had almost 7 inches of rain, while there was 1,43 inches of rain this past November. It's intriguing to wonder if the 5 degree warmer water in 1997 accounts for the higher November rain totals? To pursue this further I will next look at the 1997 Bodega Bay data to see if there is more complete water temperature data!  Update 12/3/15 checking Bodega buoy data finds no useable data for all of 1997 and no data in 1998 until 3/28/98. So no earth shaking revelations here, just an exercise by a concerned citizen to help shake out the speculations from the actual data. Although our local waters are just a small part of the whole system, I wonder if water temperatures locally can be predictors of the El Niño effect.....not sure of that but the elevated temperatures over 2014 and 2015 is surly indications of a planet in distress!